Statistics on Slavery in New Jersey
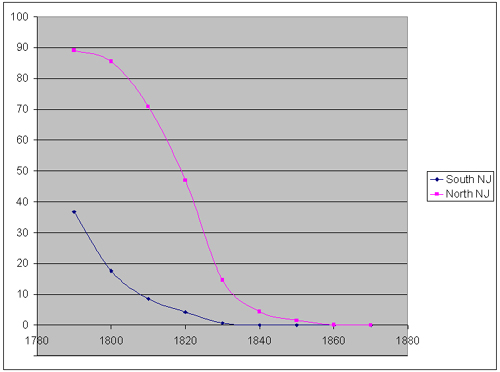
1) Percentages of African-American population enslaved in New Jersey, 1790 - 1870 (by north/south region)
2) Percentages of African-American population enslaved in New Jersey, 1790 - 1870 (by county)
3) Percentages of New Jersey's total African-American population living in each region, 1790 - 1870
4) Percentages of New Jersey's enslaved persons living in each region, 1790 - 1870
5) Percent of total population that was African-American, 1790 - 1870
6) Raw numbers of African-American population in New Jersey and numbers enslaved, 1790 - 1870
7) Discussion of slavery and African-American rights in South Jersey
1) Percentages of African-American population enslaved in New Jersey, 1790 - 1870
(grouped by north/south region)
| | 1790 | 1800 | 1810 | 1820 | 1830 | 1840 | 1850 | 1860 | 1870 |
| Southern counties | 36.73 | 17.60 | 8.51 | 4.21 | 0.62 | 0.03 | 0.01 | 0 | 0 |
| Northern counties | 89.08 | 85.46 | 70.93 | 46.98 | 14.61 | 4.39 | 1.54 | 0.12 | 0 |
2) Percentages of African-American population enslaved in New Jersey, 1790 - 1870
grouped by county and north/south region
| | 1790 | 1800 | 1810 | 1820 | 1830 | 1840 | 1850 | 1860 | 1870 |
| Atlantic | | | | | | 0 | 0.46 | 0 | 0 |
| Burlington | 27.52 | 19.62 | 8.95 | 6.11 | 1.67 | 0.06 | 0 | 0 | 0 |
| Camden | | | | | | | 0 | 0 | 0 |
| Cape May | 90.97 | 55.06 | 42.19 | 12.02 | 1.32 | 0 | 0 | 0 | 0 |
| Cumberland | 46.51 | 21.68 | 8.53 | 2.89 | 0.25 | 0 | 0 | 0 | 0 |
| Gloucester | 35.83 | 8.63 | 7.71 | 3.54 | 0.26 | 0 | 0 | 0 | 0 |
| Ocean | | | | | | | 0 | 0 | 0 |
| Salem | 31.5 | 12.28 | 2.72 | 1.48 | 0.07 | 0.06 | 0 | 0 | 0 |
| Southern counties | 36.73 | 17.60 | 8.51 | 4.21 | 0.62 | 0.03 | 0.01 | 0 | 0 |
| | | | | | | | | | |
| Bergen | 92.30 | 93.33 | 73.52 | 61.38 | 23.57 | 12.68 | 2.46 | 0 | 0 |
| Essex | 87.98 | 88.48 | 59.83 | 32.16 | 10.11 | 1.04 | 0.26 | 0 | 0 |
| Hudson | | | | | | 3.33 | 0.60 | 0 | 0 |
| Hunterdon | 87.2 | 70.11 | 61.96 | 29.92 | 8.86 | 4.31 | 1.10 | 0.50 | 0 |
| Mercer | | | | | | 0.94 | 0.29 | 0 | 0 |
| Middlesex | 90.40 | 85.6 | 66.12 | 49.49 | 14.53 | 1.79 | 0.8 | 0.08 | 0 |
| Monmouth | 81.89 | 77.72 | 70.41 | 55.96 | 9.87 | 3.75 | 3.13 | 0 | 0 |
| Morris | 92.98 | 88.57 | 80.75 | 58.98 | 17.06 | 3.90 | 1.85 | 0.15 | 0 |
| Passaic | | | | | | 10.86 | 4.8 | 0.36 | 0 |
| Somerset | 92.49 | 91.41 | 86.16 | 43 | 19.42 | 5.98 | 1.78 | 0.56 | 0 |
| Sussex | 87.10 | 83.44 | 63.99 | 44.42 | 11.28 | 3.54 | 0.29 | 0 | 0 |
| Union | | | | | | | | 0.12 | 0 |
| Warren | | | | | 10.02 | 1.73 | 0.52 | 0 | 0 |
| Northern counties | 89.08 | 85.46 | 70.93 | 46.98 | 14.61 | 4.39 | 1.54 | 0.12 | 0 |
| | | | | | | | | | |
| New Jersey | 80.53 | 73.83 | 58.07 | 37.75 | 10.96 | 3.10 | 0.98 | 0.07 | 0 |
3) Percentages of New Jersey's total African-American population living in each region, 1790 - 1870
grouped by north/south region
| | 1790 | 1800 | 1810 | 1820 | 1830 | 1840 | 1850 | 1860 | 1870 |
| Southern Counties | 16.3 | 17.1 | 20.6 | 21.6 | 26.1 | 29.5 | 36.5 | 38.9 | 43.0 |
| Northern Counties | 83.7 | 82.9 | 79.4 | 78.4 | 73.9 | 70.5 | 63.5 | 61.1 | 57.0 |
4) Percentages of New Jersey's enslaved persons living in each region, 1790 - 1870
grouped by north/south region
| | 1790 | 1800 | 1810 | 1820 | 1830 | 1840 | 1850 | 1860 | 1870 |
| Southern Counties | 7.4 | 4.1 | 3.0 | 2.4 | 1.5 | 0.3 | 0.4 | 0.0 | N/A |
| Northern Counties | 92.6 | 95.9 | 97.0 | 97.6 | 98.5 | 99.7 | 99.6 | 100.0 | N/A |
5) Percent of total population that was African-American, 1790 - 1870
grouped by north/south region
| | 1790 | 1800 | 1810 | 1820 | 1830 | 1840 | 1850 | 1860 | 1870 |
| Southern Counties | 4.4 | 4.7 | 5.2 | 5.2 | 5.8 | 6.2 | 6.0 | 5.5 | 6.1 |
| Northern Counties | 9.0 | 9.3 | 8.6 | 8.1 | 6.7 | 5.7 | 4.4 | 3.1 | 2.5 |
| Total NJ | 7.7 | 8.0 | 7.6 | 7.2 | 6.4 | 5.8 | 4.9 | 3.8 | 3.4 |
6) Raw numbers of African-American population in New Jersey and numbers enslaved, 1790 - 1870
grouped by county and north/south region
| | 1790 | 1800 | 1810 | 1820 | 1830 | 1840 | 1850 | 1860 | 1870 |
| | total | slaves | total | slaves | total | slaves | total | slaves | total | slaves | total | slaves | total | slaves | total | slaves | total | slaves |
| Atlantic | | | | | | | | | | | 234 | 0 | 218 | 1 | 194 | 0 | 184 | 0 |
| Burlington | 825 | 227 | 958 | 188 | 1039 | 93 | 1343 | 82 | 1378 | 23 | 1644 | 1 | 2109 | 0 | 2224 | 0 | 2540 | 0 |
| Camden | | | | | | | | | | | | | 2230 | 0 | 2574 | 0 | 4430 | 0 |
| Cape May | 155 | 141 | 178 | 98 | 192 | 81 | 233 | 28 | 228 | 3 | 198 | 0 | 247 | 0 | 273 | 0 | 427 | 0 |
| Cumberland | 258 | 120 | 346 | 75 | 598 | 51 | 623 | 18 | 788 | 2 | 896 | 0 | 1130 | 0 | 1295 | 0 | 1767 | 0 |
| Gloucester | 533 | 191 | 707 | 61 | 960 | 74 | 1103 | 39 | 1553 | 4 | 1631 | 0 | 620 | 0 | 707 | 0 | 973 | 0 |
| Ocean | | | | | | | | | | | | | 140 | 0 | 124 | 0 | 117 | 0 |
| Salem | 546 | 172 | 692 | 85 | 1066 | 29 | 1016 | 15 | 1412 | 1 | 1797 | 1 | 2075 | 0 | 2462 | 0 | 2737 | 0 |
| Southern counties | 2317 | 851 | 2881 | 507 | 3855 | 328 | 4318 | 182 | 5359 | 33 | 6400 | 2 | 8769 | 1 | 9853 | 0 | 13175 | 0 |
| | 1790 | 1800 | 1810 | 1820 | 1830 | 1840 | 1850 | 1860 | 1870 |
| | total | slaves | total | slaves | total | slaves | total | slaves | total | slaves | total | slaves | total | slaves | total | slaves | total | slaves |
| Bergen | 2493 | 2301 | 3027 | 2825 | 2965 | 2180 | 2742 | 1683 | 2478 | 584 | 1751 | 222 | 1665 | 41 | 1663 | 0 | 1632 | 0 |
| Essex | 1331 | 1171 | 1719 | 1521 | 1887 | 1129 | 2049 | 659 | 2157 | 218 | 1928 | 20 | 2334 | 6 | 1757 | 0 | 2539 | 0 |
| Hudson | | | | | | | | | | | 330 | 11 | 503 | 3 | 653 | 0 | 1050 | 0 |
| Hunterdon | 1492 | 1301 | 1740 | 1220 | 1806 | 1119 | 2059 | 616 | 1942 | 172 | 813 | 35 | 817 | 9 | 800 | 4 | 634 | 0 |
| Mercer | | | | | | | | | | | 2341 | 22 | 2042 | 6 | 2225 | 0 | 2368 | 0 |
| Middlesex | 1458 | 1318 | 1827 | 1564 | 1963 | 1298 | 2045 | 1012 | 2127 | 309 | 1563 | 28 | 1380 | 11 | 1308 | 1 | 1545 | 0 |
| Monmouth | 1949 | 1596 | 2101 | 1633 | 2136 | 1504 | 2230 | 1248 | 2299 | 227 | 2265 | 85 | 2398 | 75 | 2658 | 0 | 2910 | 0 |
| Morris | 684 | 636 | 875 | 775 | 1060 | 856 | 1114 | 657 | 967 | 165 | 948 | 37 | 1027 | 19 | 687 | 1 | 733 | 0 |
| Passaic | | | | | | | | | | | 792 | 86 | 646 | 31 | 559 | 2 | 675 | 0 |
| Somerset | 1957 | 1810 | 2038 | 1863 | 2284 | 1968 | 2609 | 1122 | 2307 | 448 | 1757 | 105 | 1742 | 31 | 1597 | 9 | 1524 | 0 |
| Sussex | 504 | 439 | 616 | 514 | 747 | 478 | 851 | 378 | 452 | 51 | 367 | 13 | 341 | 1 | 324 | 0 | 196 | 0 |
| Union | | | | | | | | | | | | | | | 865 | 1 | 1296 | 0 |
| Warren | | | | | | | | | 469 | 47 | 463 | 8 | 382 | 2 | 387 | 0 | 381 | 0 |
| Northern counties | 11868 | 10572 | 13943 | 11915 | 14848 | 10532 | 15699 | 7375 | 15198 | 2221 | 15318 | 672 | 15277 | 235 | 15483 | 18 | 17483 | 0 |
| | | | | | | | | | | | | | | | | | | |
| New Jersey | 14185 | 11423 | 16824 | 12422 | 18703 | 10860 | 20017 | 7557 | 20557 | 2254 | 21718 | 674 | 24046 | 236 | 25336 | 18 | 30658 | 0 |
derived from Appendix 3 of Afro-Americans in New Jersey: a short history. Giles R. Wright; Trenton, NJ, New Jersey Historical Commission, 1989.
Home (westjersey.org)
This site maintained by Bob Barnett.
Last updated: 2011 First Month, 2nd.